Design Space Lab is a web-based tool currently in development that uses data visualization and machine learning to offer rich exploration features for performance-driven design. The tool is powered by a Python backend and a Javascript front-end, and it connects to CAD software using a lightweight C# client.
Release: Spring 2020
With Caitlin Mueller
The tool has not been released yet and still requires a substantial amount of development. It is slated for release in the spring of 2020, just in time for my Ph.D. defense. Until then, this page showcases an early prototype (coded in JavaScript with D3.js) of one of the data visualization features that will help designers understand and explore solution spaces.
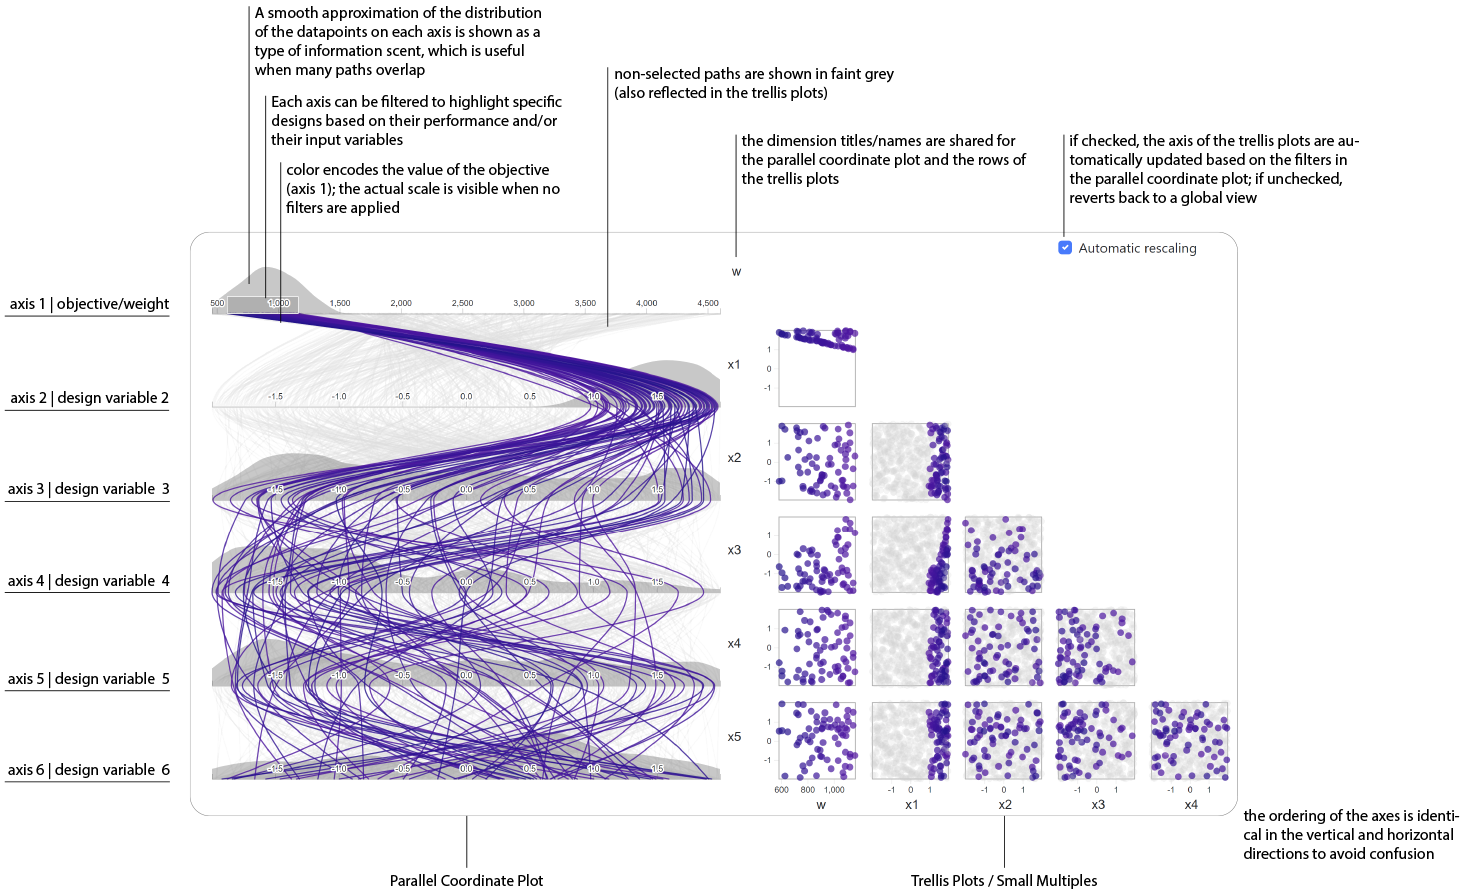
A design space is defined by design variables/parameters, which control the design geometry. For a given set of design variables, the resulting geometry of the design can be evaluated based on the function that the design needs to fulfill. For example, if we define a design space for a roof truss, we would like it to be as lightweight as possible to reduce cost and material consumption. In this case, weight is our performance metric, and it is affected by the geometry of the truss, itself controlled by design variables. Exploring the relationship between the design variables, the objective, and the design geometry is key to converging to a good design option. This exploration can be done manually, but it is usually too tedious to be effective. Another option is to use optimization, which may or may not return the optimal answer (given objective functions used in design are rarely convex), but optimization will typically not be able to take into account unquantifiable criteria of importance, say aesthetic appeal, which require a human designer to be assessed. An alternative is thus to sample the design space and visualize it. The trick here is to not only visualize the relationship between design variables and objectives but also to visualize the design geometry itself. By using parallel coordinate and trellis plots, this prototype offers a first strategy to do so. The source code is available here.
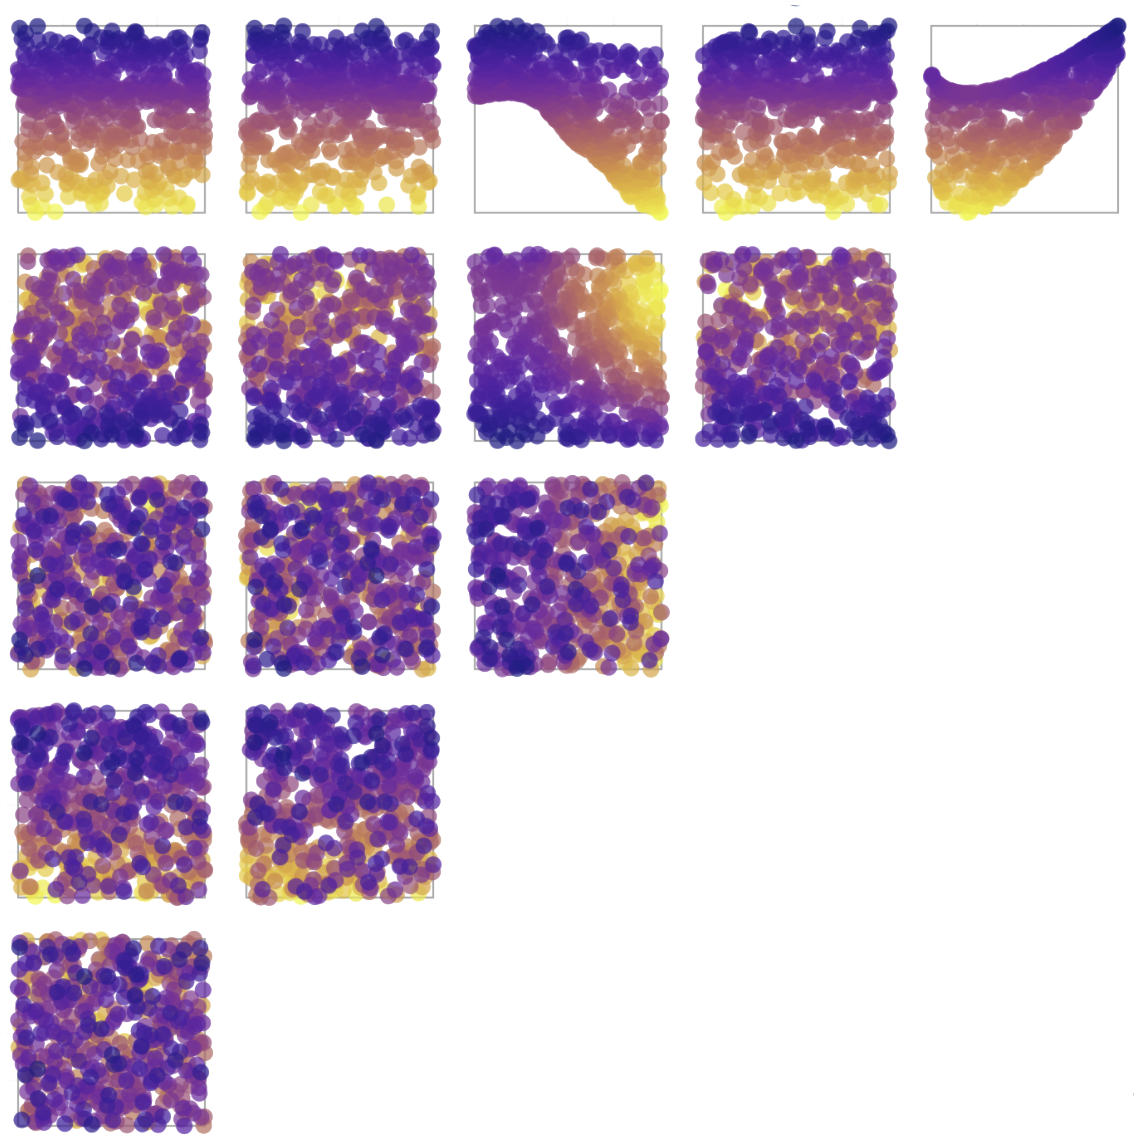
The prototype is intended to be broadly applicable to different design problems. For the purpose of this demo, I built a design space that generates roof trusses based on 5 input variables. Using that design space, I automatically sampled 500 trusses, which were evaluated for weight. In addition, I took a screenshot of the front and side views of each truss geometry. To summarize, we have 500 datapoints of the form [x1, x2, x3, x4, x5, w] with an associated image glyph-#.png.
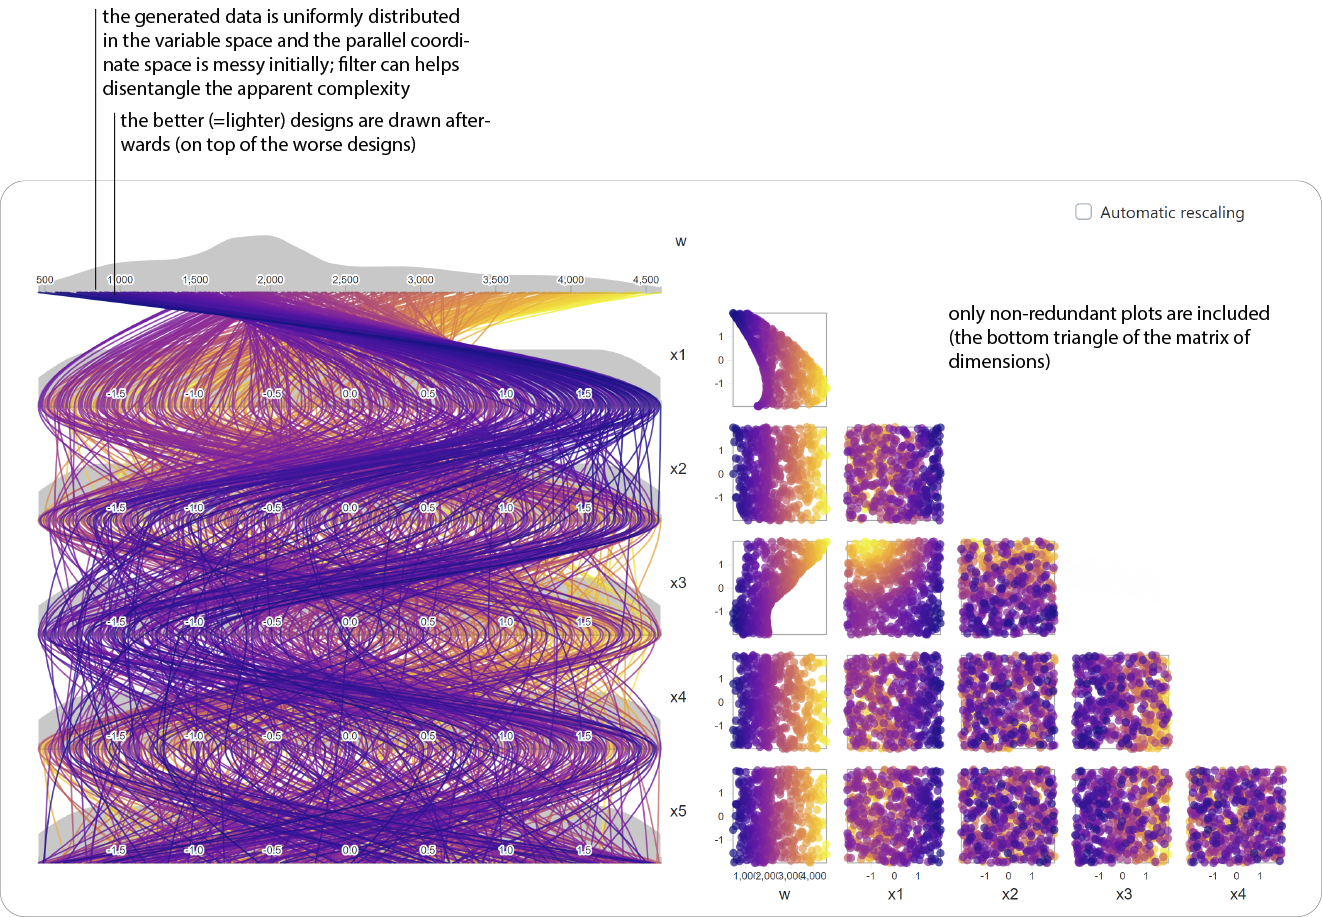
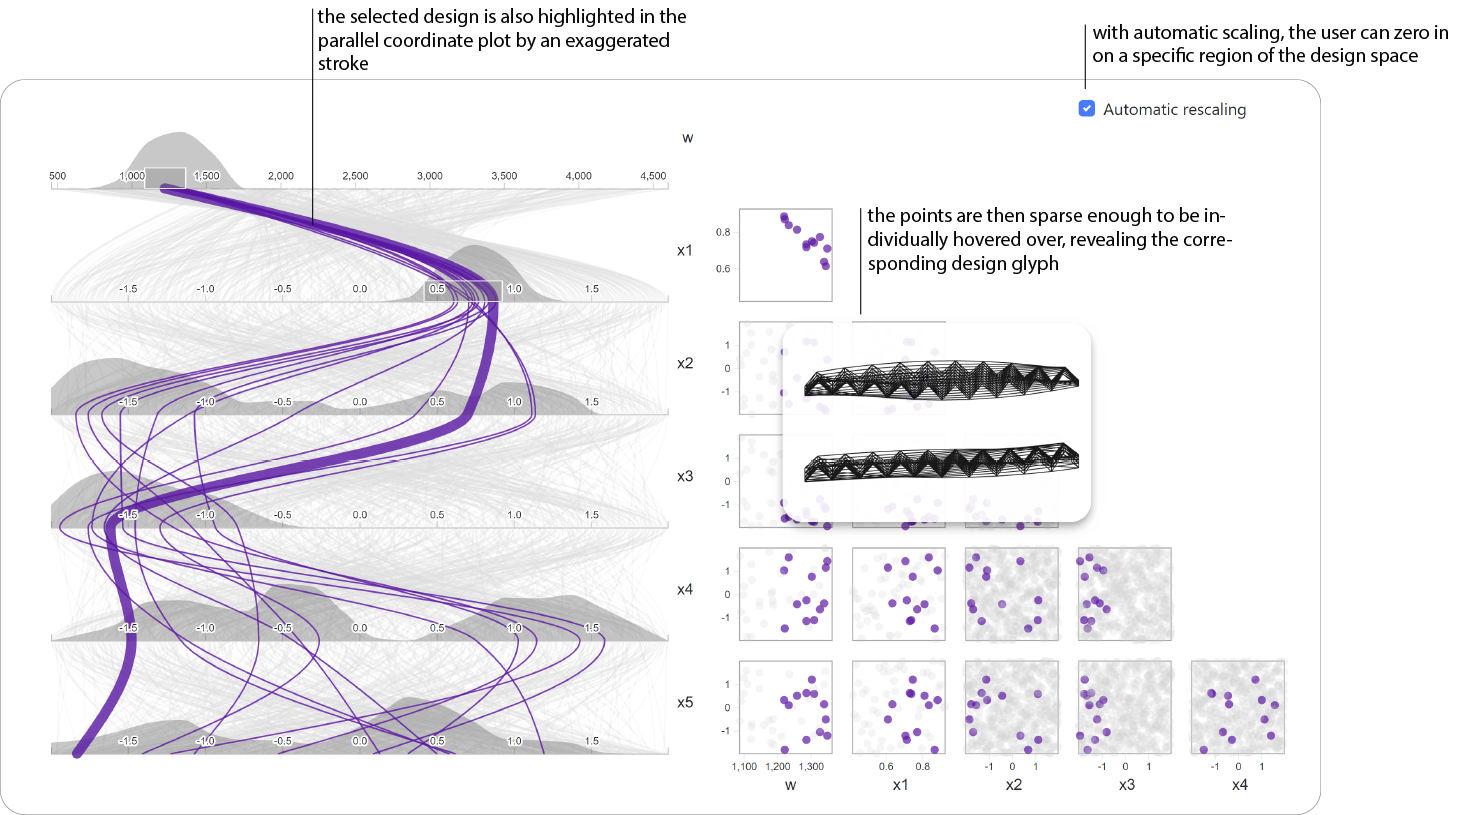
The following diagrams detail the different features of the visualization.
Design Space Lab is currently in development and slated for release in the spring of 2020.