We developed a system to generate 3D voxel-based chairs based on sketch input. Our work relied on recent progress in 3D Generative Adversarial Networks (GANs). 3D GANs are conceptually similar to the image GANs, which are capable of generating, among other things, realistic fakes of celebrites (Karras et al., 2018), but they generate shapes instead.
With Diego Pinochet and Caitlin Mueller
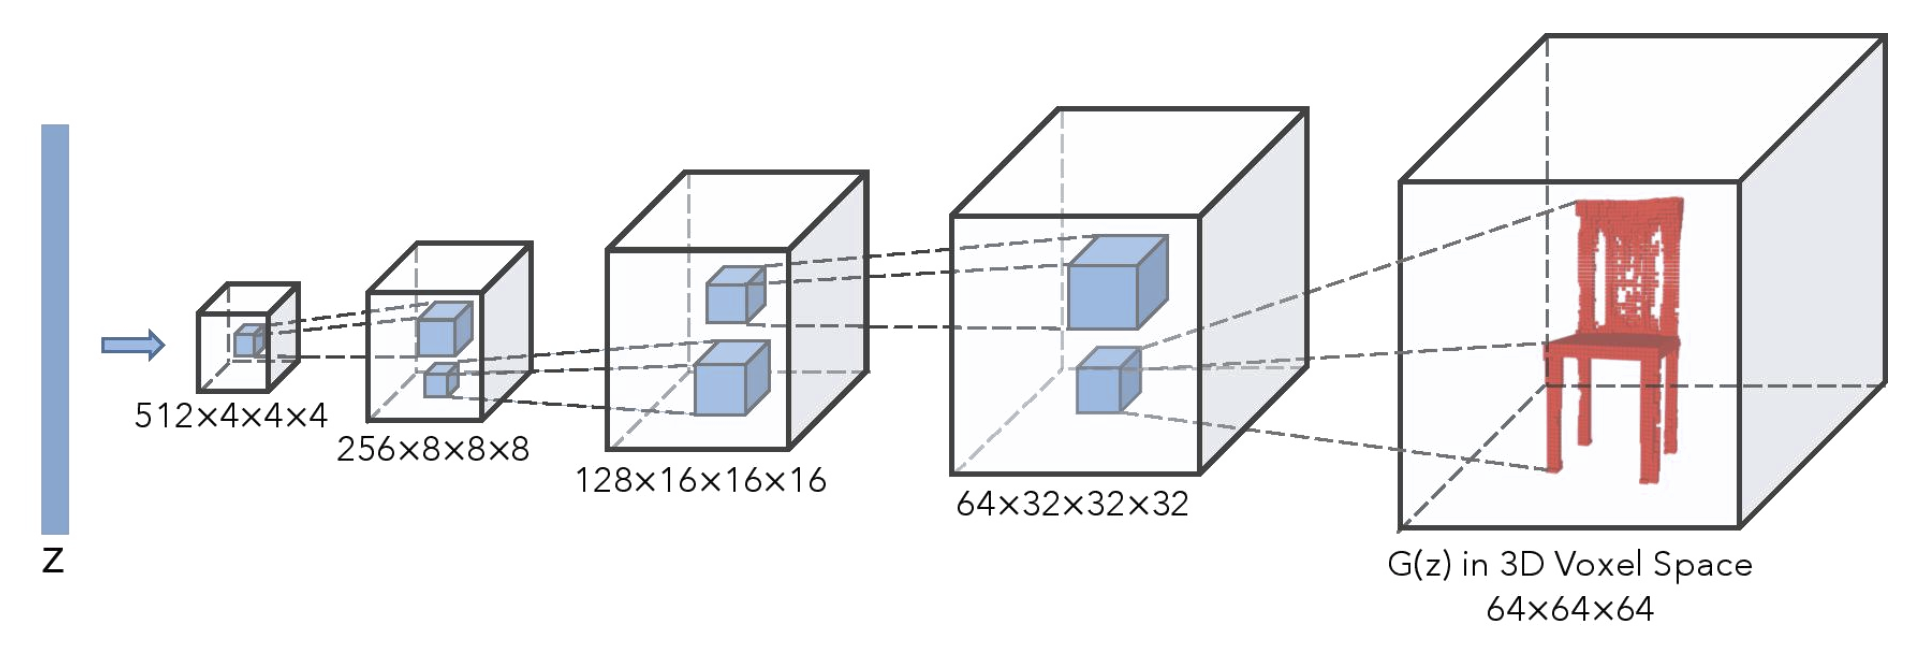
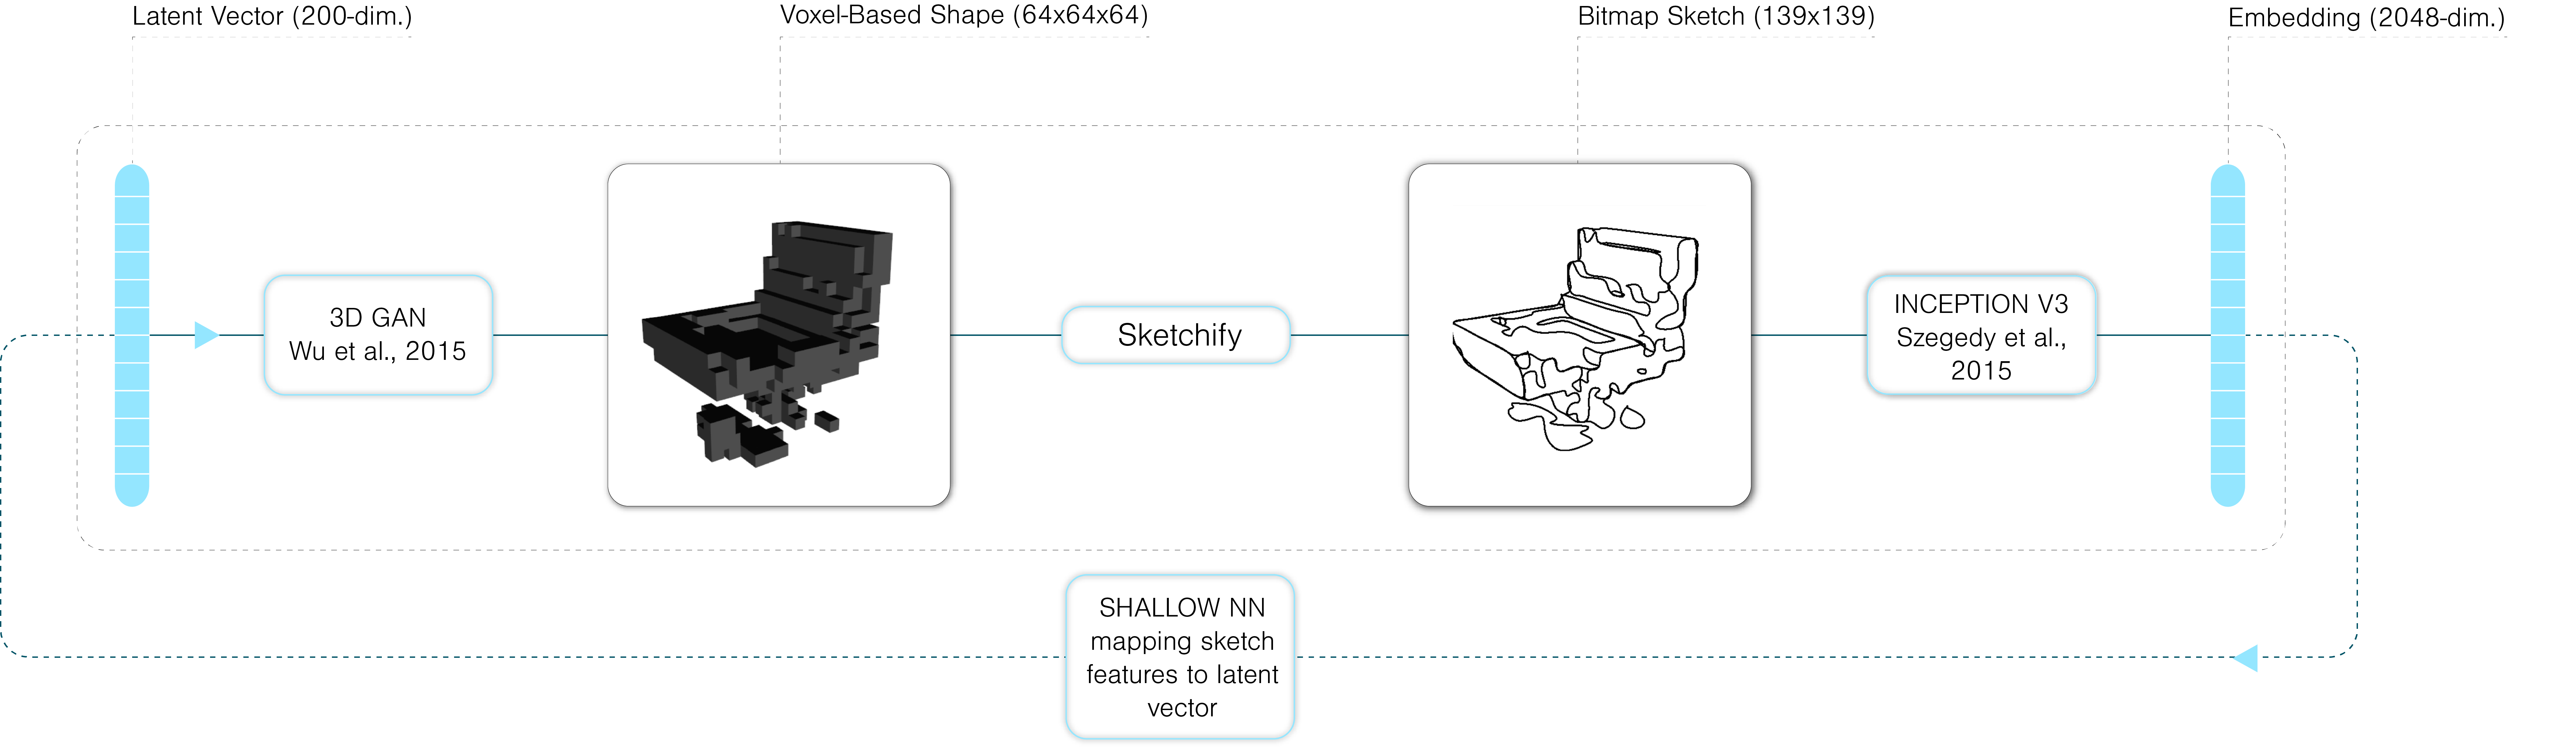
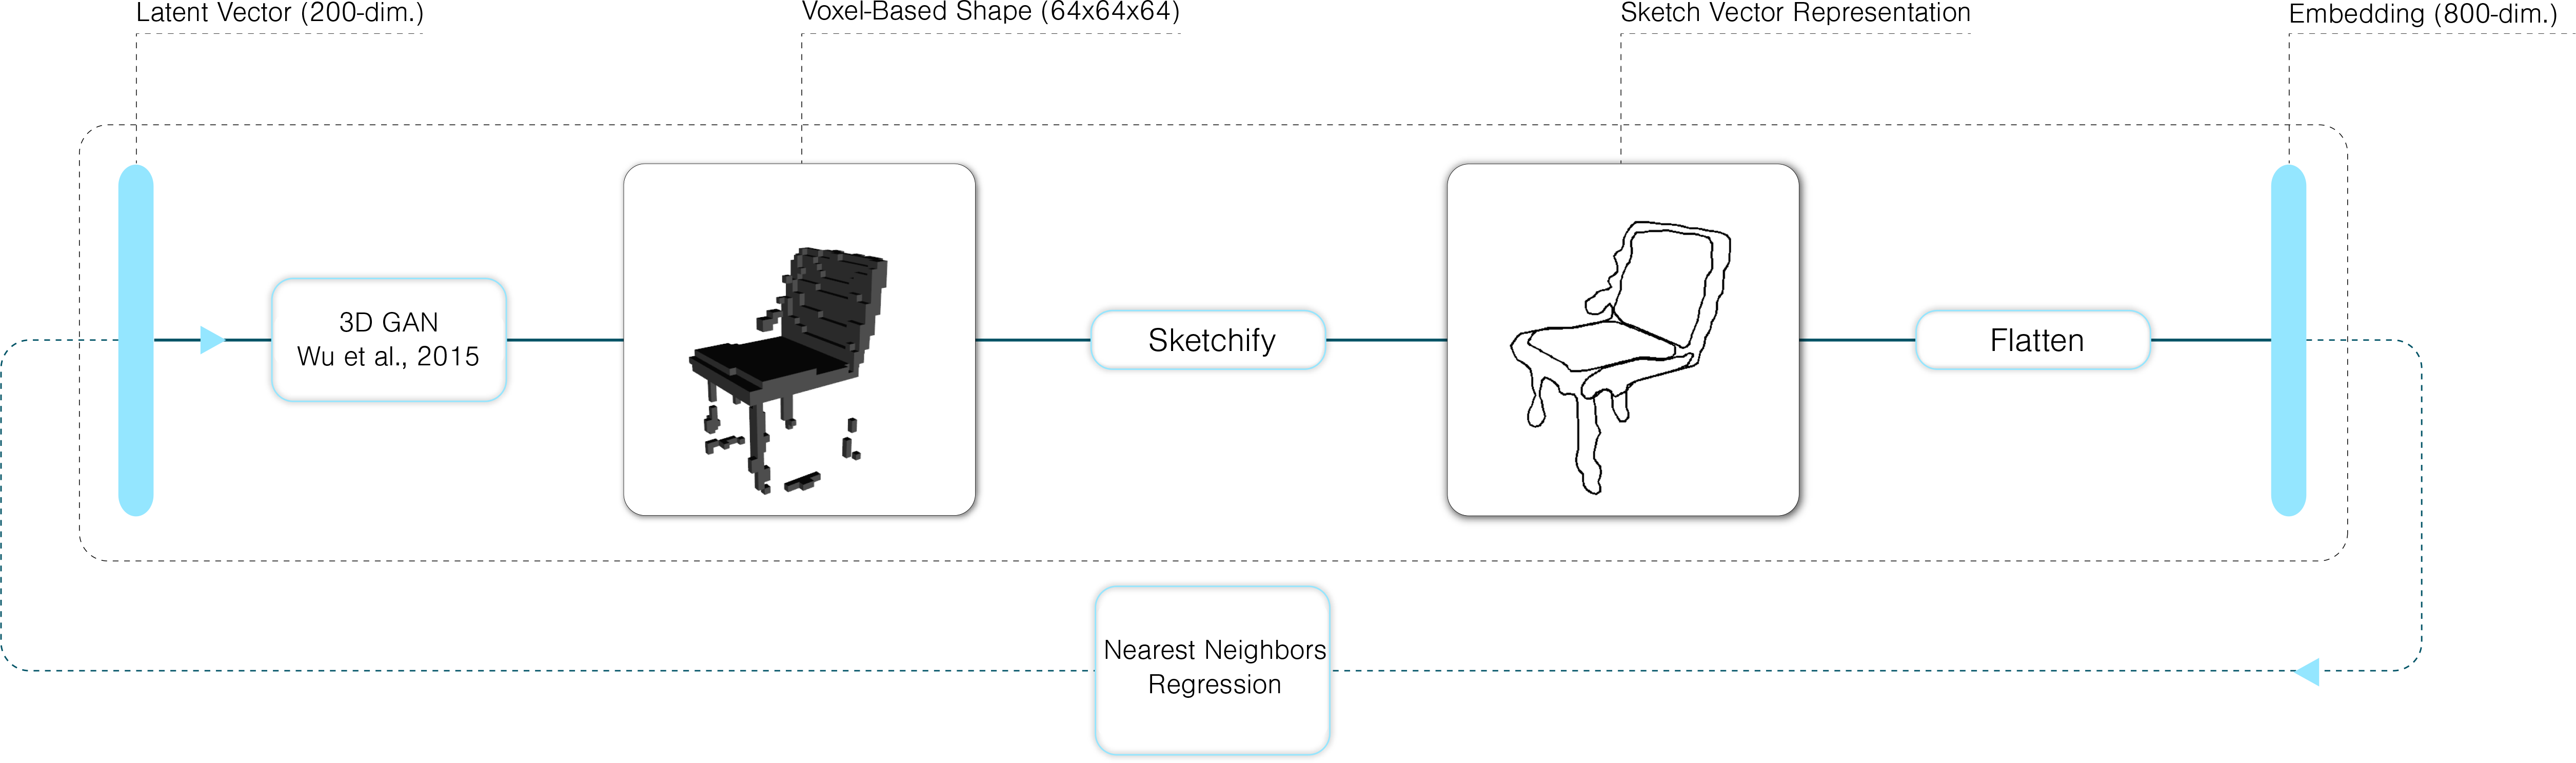
Whereas image GANs generate 2D arrays/matrices, 3D GANs generate 3D arrays/matrices. The shape is described by density values (between 0 and 1), which can be interpreted as a material density values, 0 and 1 corresponding respectively to void and solid regions. We use the 3D GAN model for chairs developed by Wu et al. (2016), whose architecture is shown below, to generate a large number of chairs by sampling the latent vector. Each 3D model is rendered as an image, and each image is converted into a sketch. With paired sketch/latent vector data, we built a model mapping a processed sketch onto a latent vector, which in turn is fed into the 3D GAN to generate a chair.
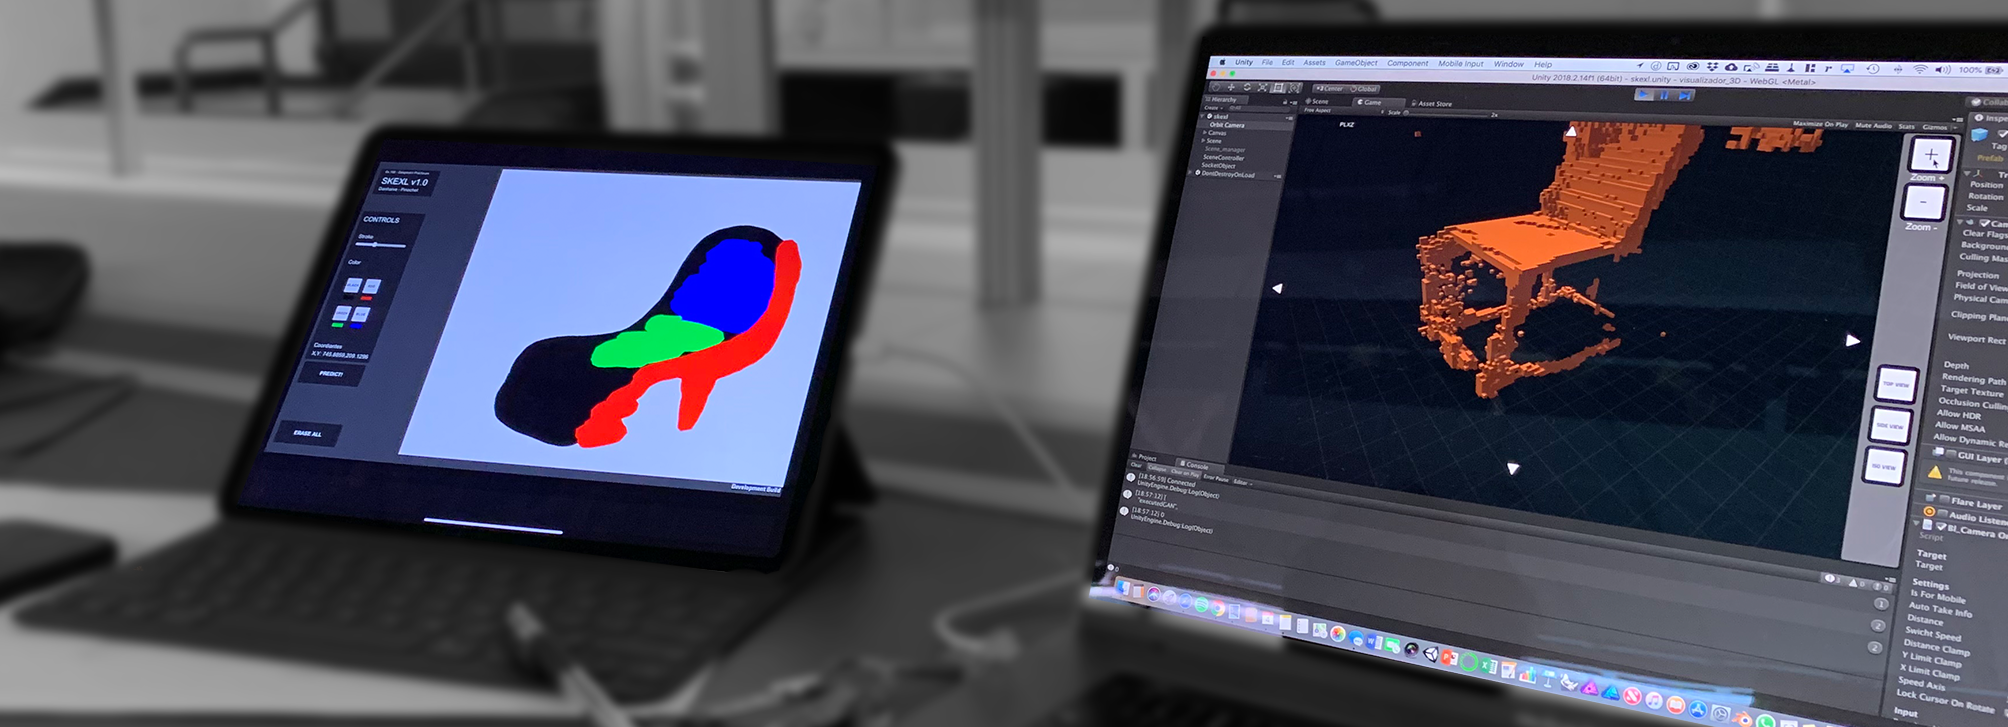
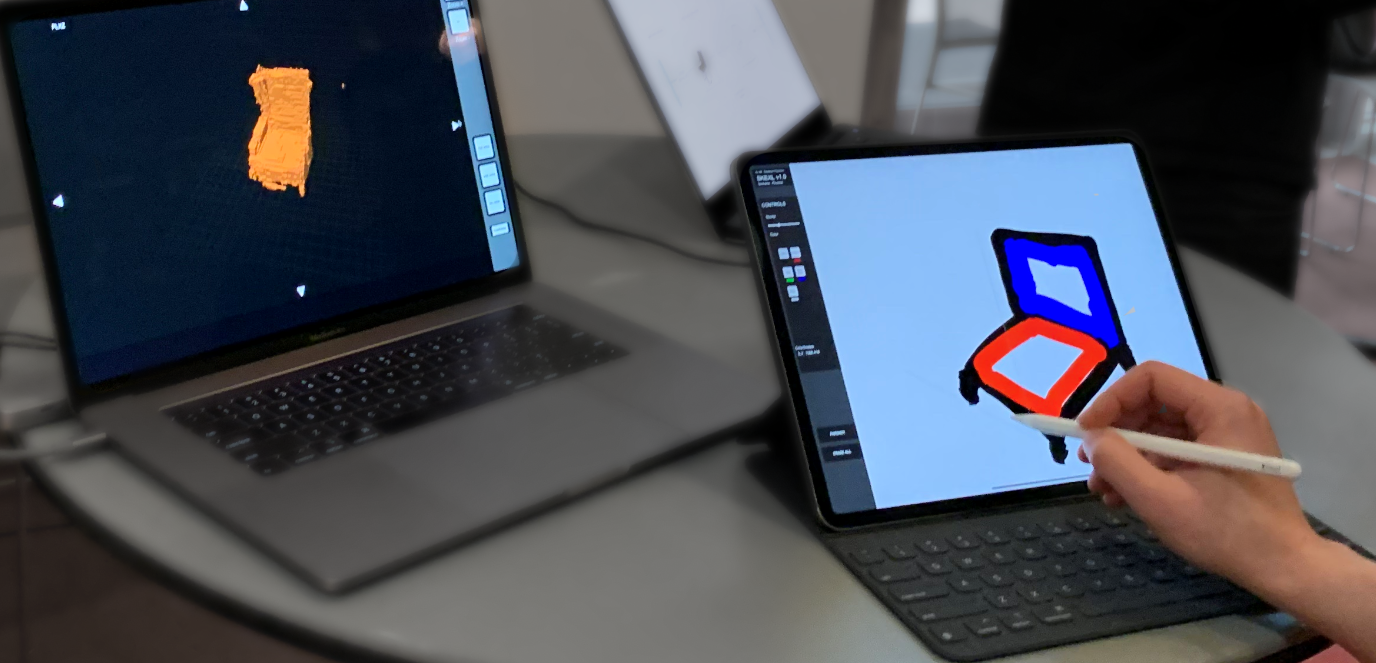
Finally, we developed a Unity sketching interface and a 3D visualization app, which communicate through a Flask server to send the human-drawn sketch, process it, predict the corresponding latent vector, and finally generate a chair shape. The finished physical setup is shown below.
The video below shows our apps being used on real data (human-drawn sketches). It shows that the system is fairly sucessful, even though there is room for vast improvements. After processing the input sketch, our machine learning model is capable of predicting different chairs with distinct features, such as armrest, back inclination, or chair smoothness.
There is no real-world paired sketch-shape data—all of our data is artificial—and we cannot compute a real-world error metric. However, we observe qualitatively that the system, despite being far from perfect, performs reasonably well and allows users to explore different chair shapes intuitively.
3D modelling is hard and requires a significant amount experience to get anything done. In contrast, sketching is a much more natural way to quickly explore ideas, but it does not provide ways to readily visualize them in 3D or quantify their merits through analysis requiring 3D information (e.g. structural analysis). 3D GANs allow us to avoid sketching or modelling altogether. For example, in Wu et al.’s 3D GAN, different chair shapes are generated by modifying a 200-dimensional input latent vector.
The main issue with using a 3D GAN to explore ideas is that most dimensions of the latent vector are meaningless to a human designer. In addition, such a design space is hard to explore because of its large number of parameters. This project seeked to provide a natural way to interact with 3D GANs, by means of interactive sketching.
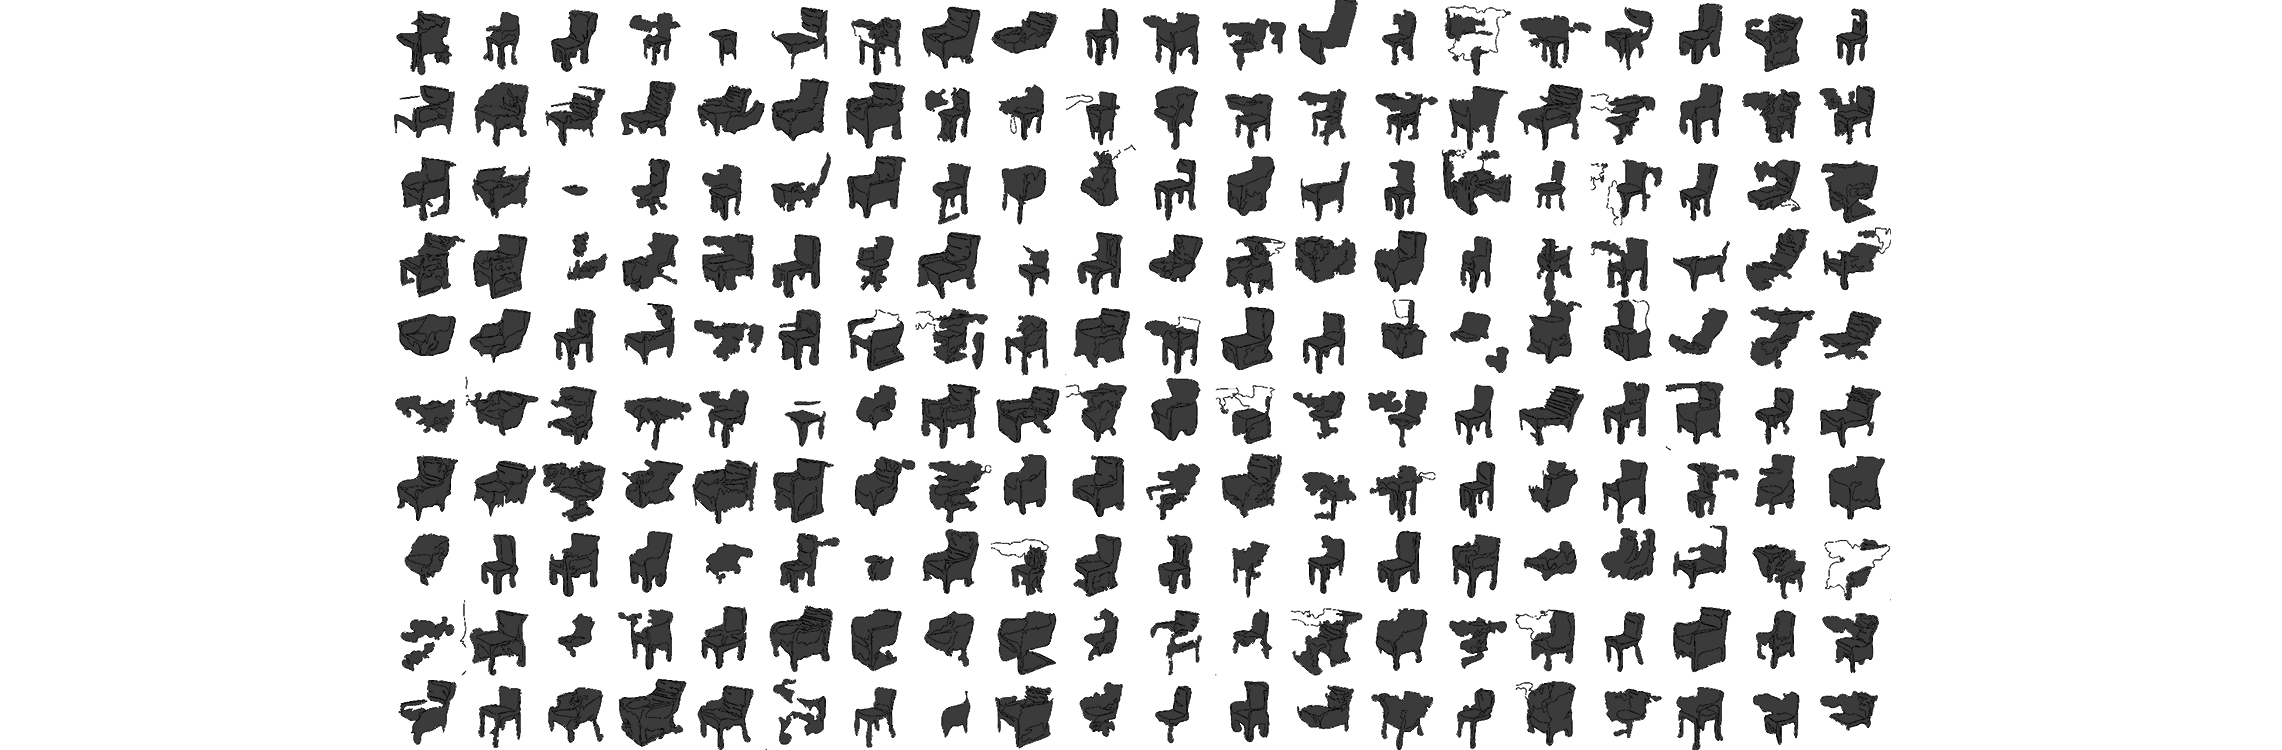
We needed paired sketch/model data, and there was no way we could find enough real-world data to feed our model. Therefore, we opted for artificially generating all of the data required for this project. To do so, we sample 10,000 200-dimensional latent vectors where each coordinate was in the domain [-1,1]. To obtain better coverage of the high-dimensional design space, we used latin hypercube sampling. Each of the sampled latent vectors was fed into the 3D GAN to generate a voxelized shape, and each shape was automatically rendered in a 3D viewer. The image below shows a collection of renders obtained using the strategy outlined above.
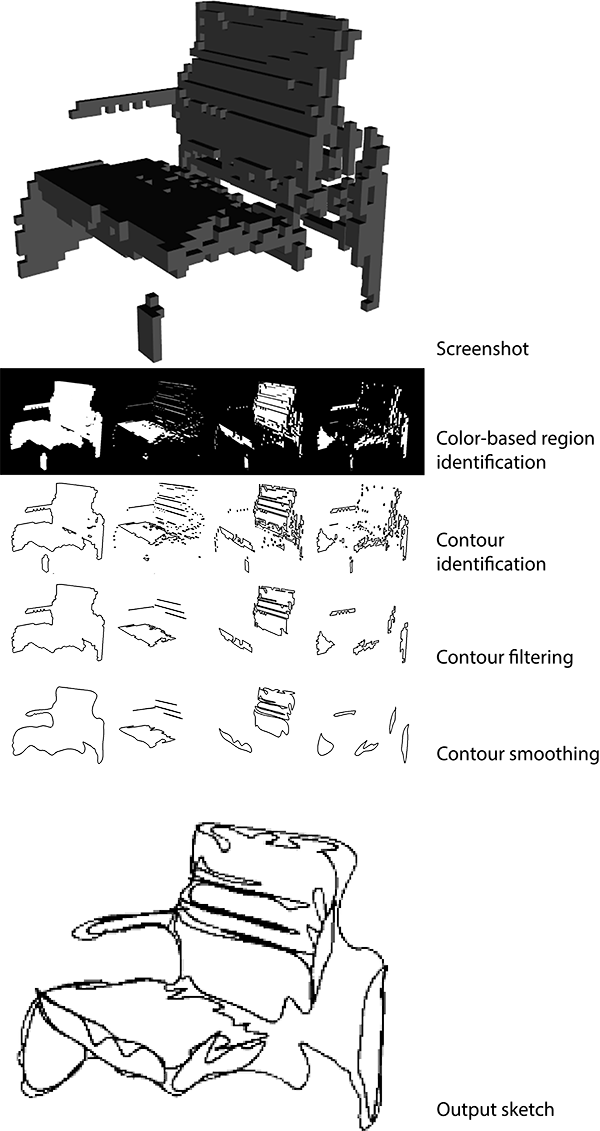
The next step consisted in converting these screenshots into sketch-like images. The goal here was to obtain sketches that would look like they could have been hand-drawn by a human. To do so, contours in the original render are identified, simplified and smoothed using a B-spline approximation. The smallest contours are filtered out. The image below shows result samples obtained from renders of 3D models.
Some if not all of the sketches do not quite look human-drawn: they’re a little too wiggly and include too many details, despite our attempts to smooth them out. However, as detailed in the next section, by simplifying the sketch representation and retaining only a few strokes per sketch, we achieved good results. Once all renders (corresponding to a specific latent vector) are turned into sketches, we have paired sketch-latent vector data, which we used to learn a mapping from sketch to generating latent vector.
Turning renders into satisfactory sketches required subtantial tuning. We wished we could use a data-driven method to do so, but that required data that was simply not available. Instead, we developed a workflow that worked well enough.
The first trick was to apply different shades of gray to the faces of the voxels defining a shape, as shown below.
Through this, we can identify regions of the screenshots independently. For example, we know one of the contours of the regions with a color value of [7, 7, 7] will represent the seat of the chair. Once these regions are identified, we can extract meaningful contours and filter out those that amount to noise. We took two approaches to converting renders to sketches. The first one is image-based and corresponds to the training setup where we used a CNN embedding whereas the second one is vector-based and simplifies each render more by only extracting 4 contours.
The first strategy consists in identifying screenshot contours and retaining only those with bounding boxes that are tall or wide enough. This filtering is useful to only keep contours that are meaningful to the overall drawing. The contours are then drawn onto a white canvas with a 139x139 resolution, and the resulting image is the sketch.
As detailed in the next section the image-based representation did not yield satisfactory results, and we decided to represent sketches with a more natural, simple representation. Instead of filtering out the smallest contours, we only kept the biggest one for each region of the screenshot (front, side, top, entire shape). In addition, prior to identifying the contours, we blurred each region of the image in order to suppress some of the artifacts due to the voxel-based representation of the shape (see image below).
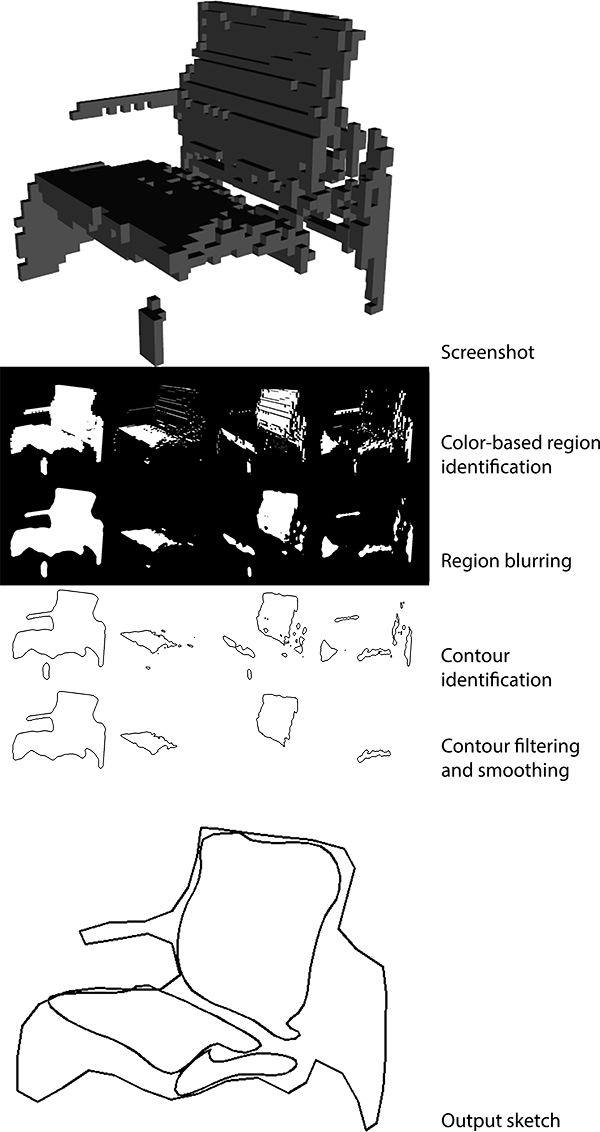
Each of these contours is approximated by a B-spline that we evaluate at 200 points. Each contour thus corresponds to 400 features, and since we consider 4 contours, we end up with a 1600-dimensional feature representation. Importantly, we normalize the coordinates of all contours by subtracting the minimum x-coordinate and dividing by the total width of the outline. As a result, the size of the sketch is irrelevant for the prediction system. Note that the aspect ratio of the sketch is preserved as we only normalize with respect to the x-direction. The image below shows the results for screenshot samples:
At this point, we were pretty happy with the results above: the strategy extracts good sketch features, leaving out unnecessary information. The overall outline, in black, is particularly good, whereas the inner contours are sometimes a bit weird. To lend more importance to the black outline, its corresponding coordinates are multiplied by a factor of 15 in the final feature vector for a given sample (this factor can be seen as a hyperparameter of our model).
We pursued two distinct approaches to create a model capable of predicting a latent vector for the 3D GAN based on a sketch input. The first strategy relied on the image-based sketch representation discussed above, while the second one was based on the vector representation.
In this approach, instead of building a CNN from scratch, we used a powerful model pretrained on the ImageNet dataset, Inception-v3 (Szegedy et al., 2015), to compute embeddings for each layer. Specifically, we removed the last prediction layer of Inception-v3 to only retain the 2048-dimensional embedding—also called bottleneck features—used as features for each sketch. We then used a shallow (2 to 4 layers) neural network to learn a mapping between the embedded sketch features and the latent vector. The overall setup is summarized by the diagram below:
Unfortunately, this approach did not prove successful as the shallow neural network, post-training, collapses on the mean of the training latent vectors, thus virtually predicting only one value no matter the sketch, despite attempts made to improve the architecture of the network as well as its hyperparameters. We identify two potential reasons for this poor performance:
In this case, we used the vector-based sketch representation detailed above, and predicted the latent vector of an artificial test sketch based on its closest neighbors in terms of features. Given how we represented sketches, this essentially implies that we’re identifying drawings in our existing data that are close (in terms of euclidean distance) to the curves in the test sketch, which is intuitively a sensible approach. The training setup is diagrammed below:
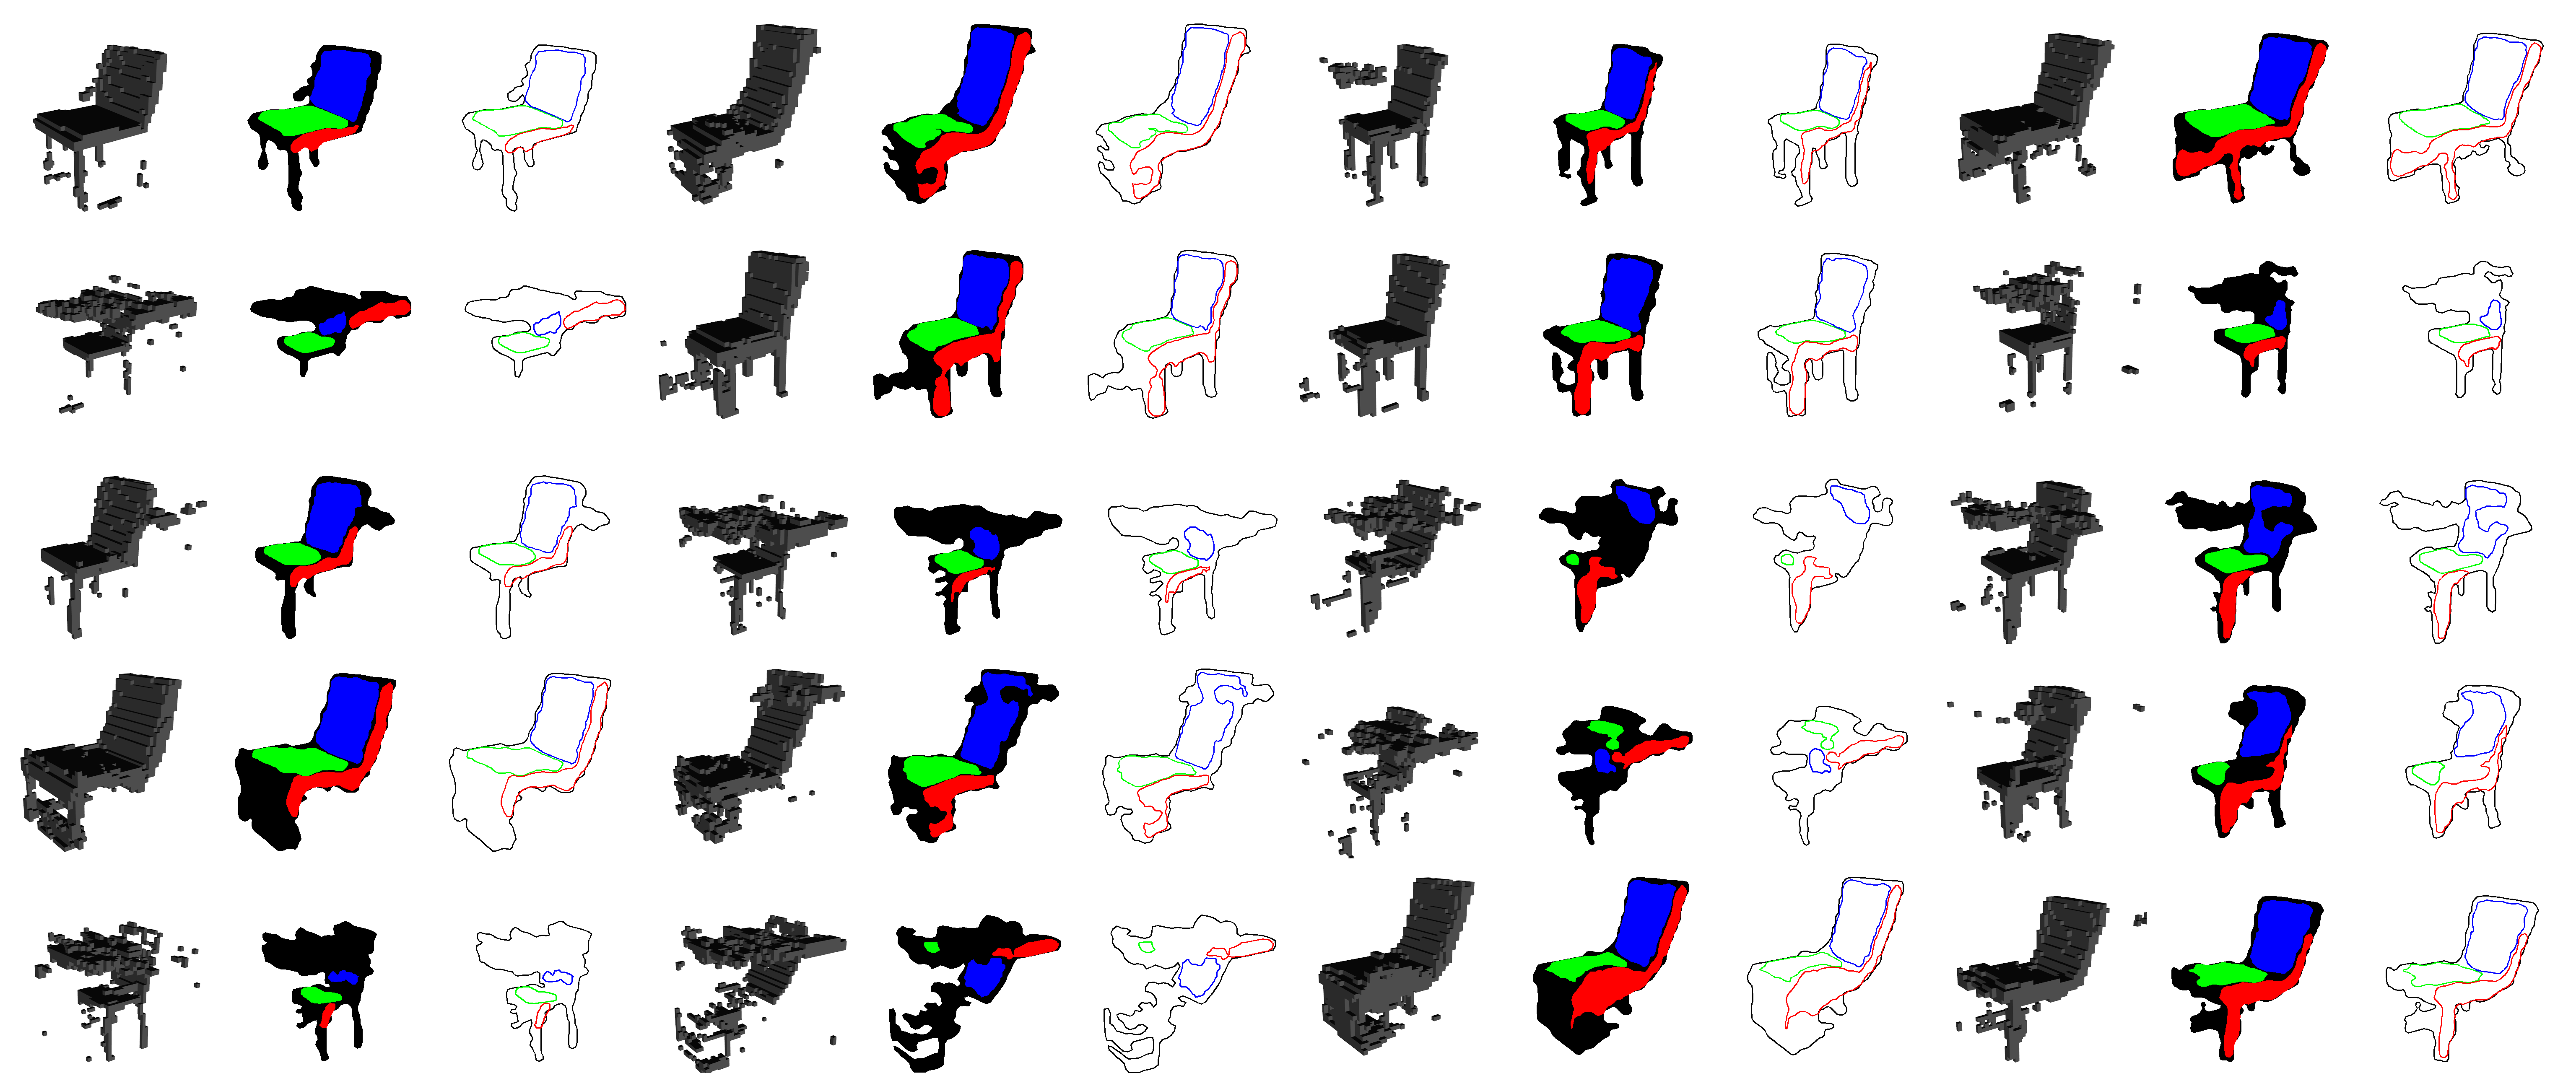
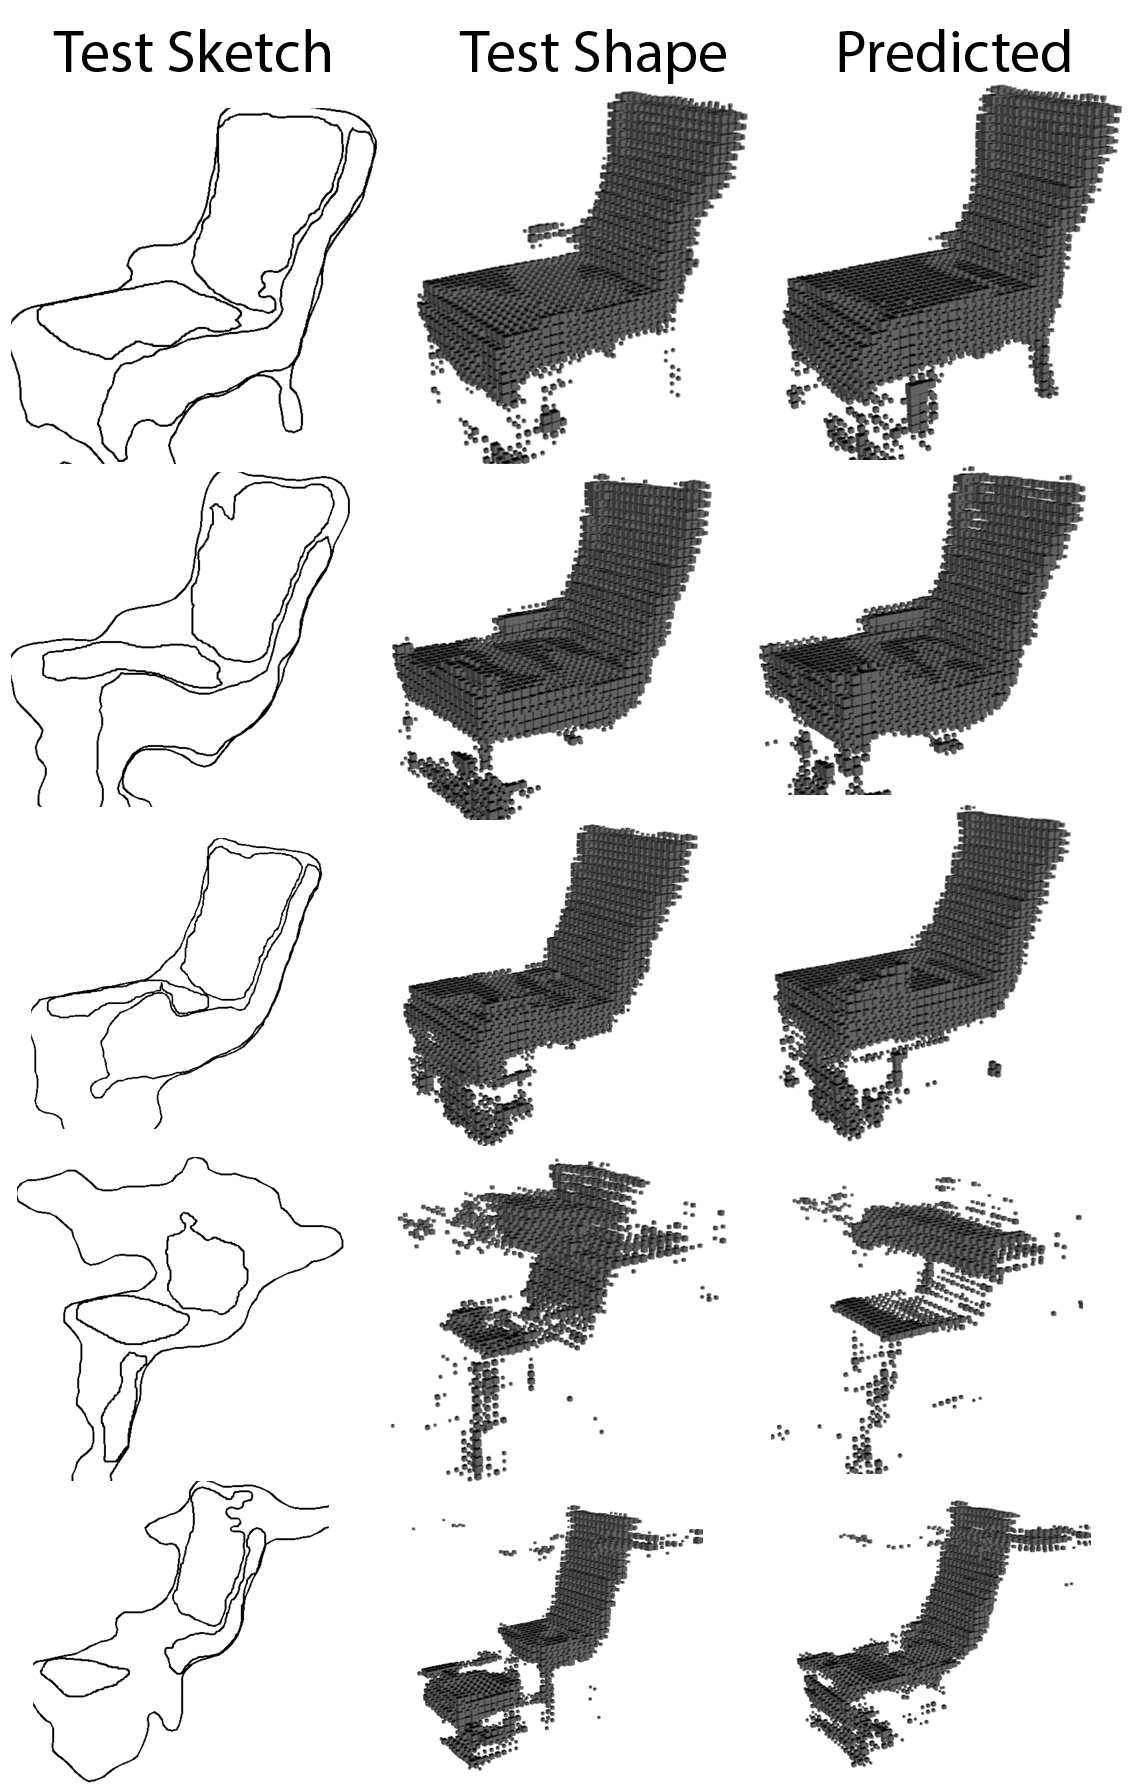
We found that this model performed well. In particular, because nearest neighbor is non-parametric (up to the chosen number of nearest neighbors), mean collapse, which was observed with neural networks, is not an issue. The image below shows a test sketch and its corresponding test shape, as well as the nearest neighbor sketches and the predicted shape.
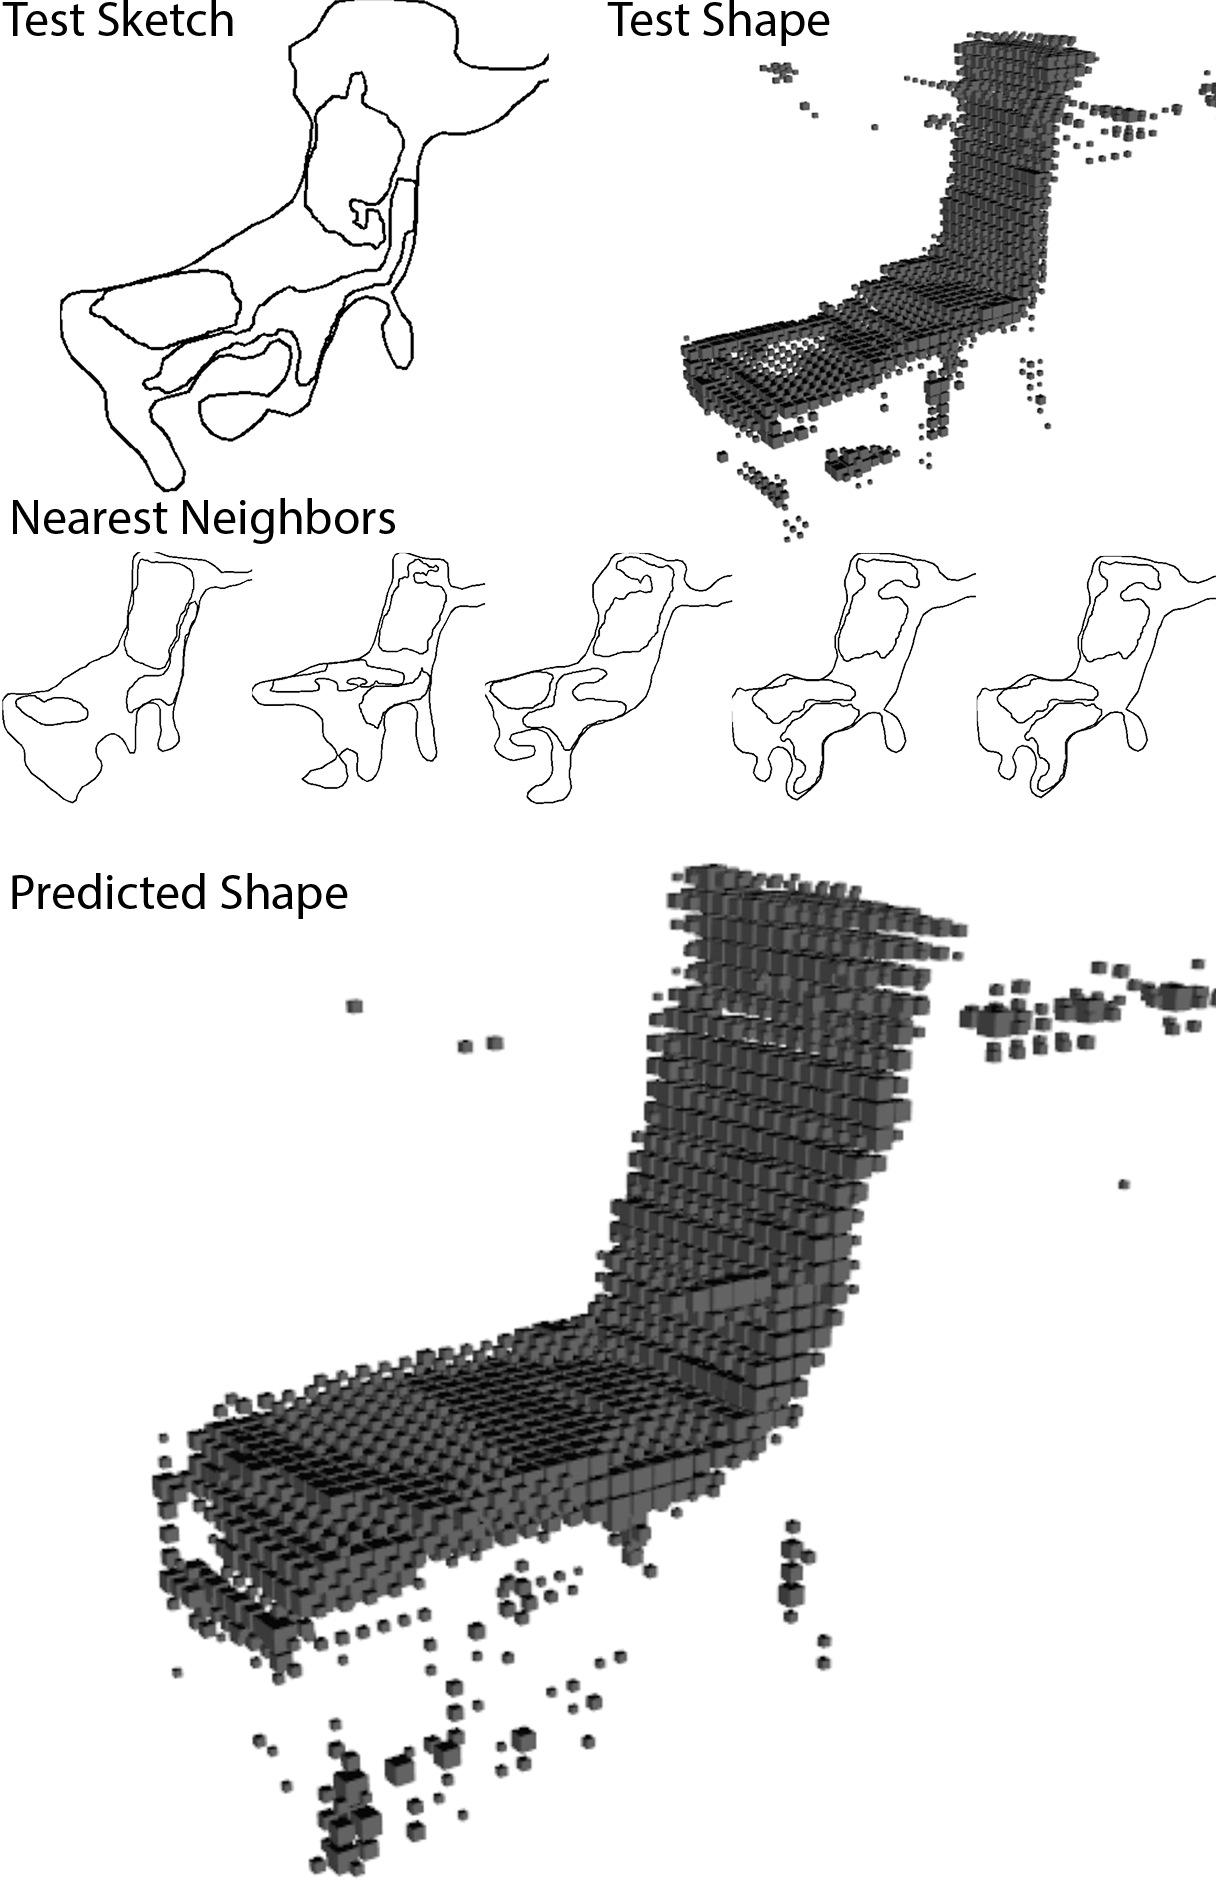
The best number of neighbors found through cross-validation is 5, and the contribution of each nearest neighbor is weighted inversely proportionally to its distance to the test sketch.
We have detailed above how we generated our training data based on the GAN and custom image processing functions. However, humans do not draw sketches that can readily be processed in the same way. Nonetheless, we can follow a similar approach if we provide users with colors to define regions based on their function. Specifically, we request that the user employs three colors to indicate different shapes in the sketch. Green is the seat region, red the side, and blue the back rest. Black allows the user to draw a general outline for the shape with no specific assignment. Each shape drawn by the user is identified by color and, for each color, the largest region is retained and its contour is extracted, which results in a format identical to the generated data, i.e. 200 points (2 coordinates) per contour (4 contours) or 1600 features.
With the nearest neighbors model and a method to process human-drawn input, the full prediction system came together as diagrammed below.
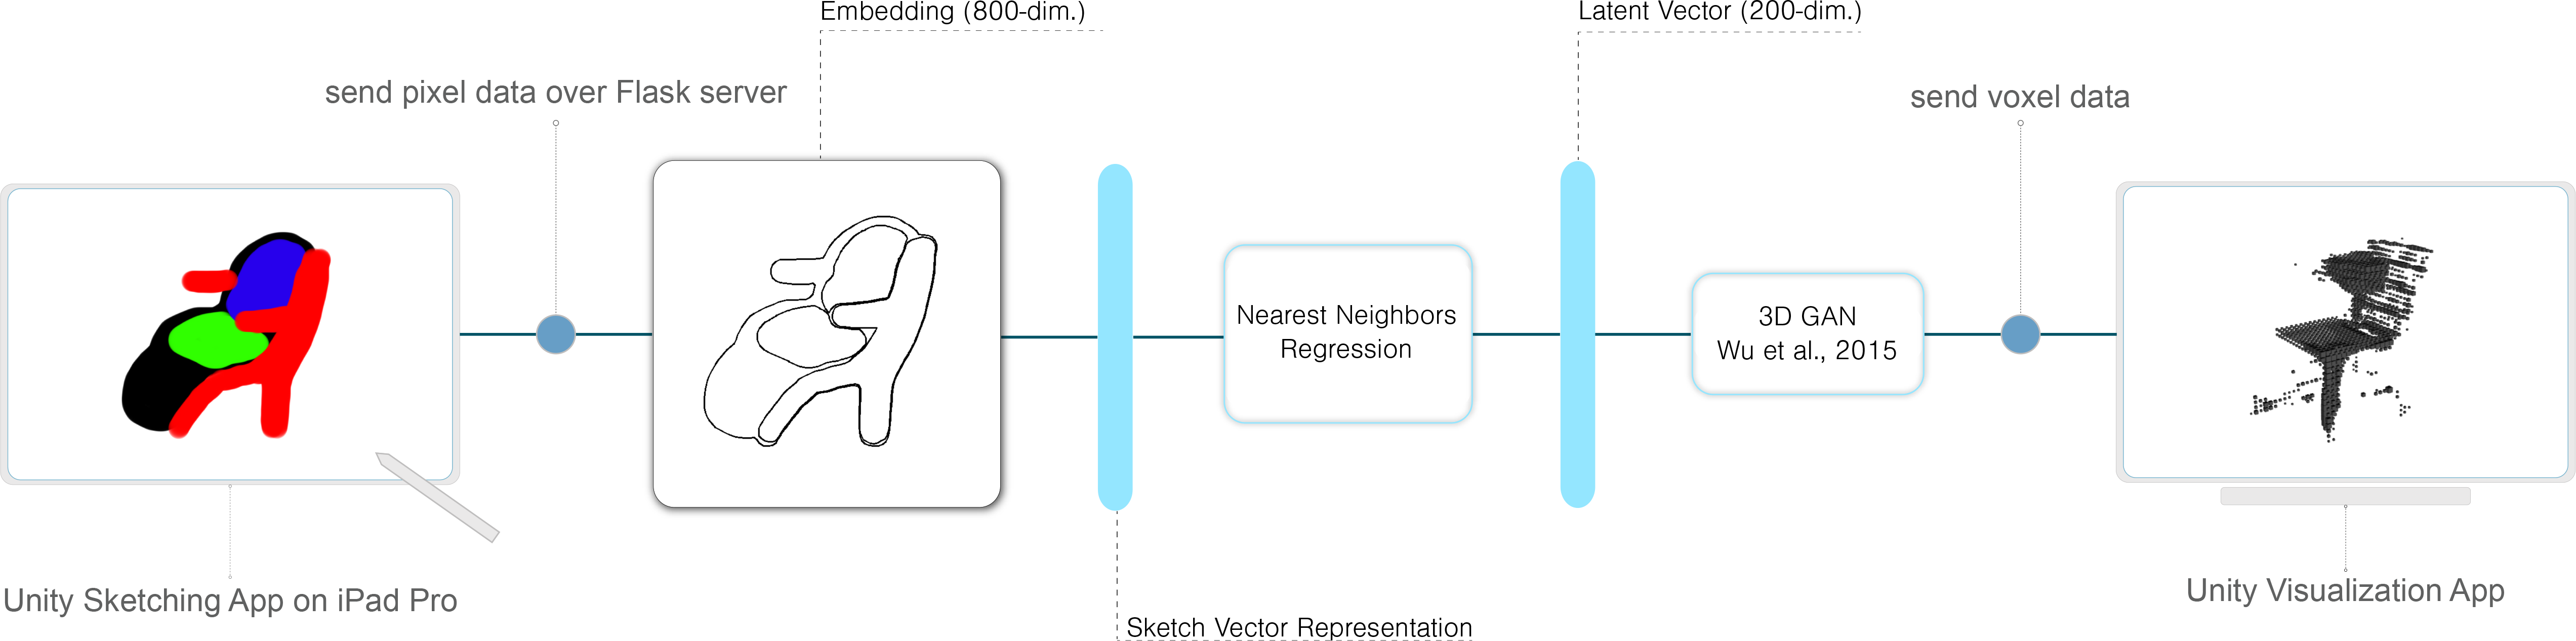
First, the image data is processed into the contour features described above. These features are used to predict a latent vector based on the 5-nearest-neighbors model. This latent vector is then fed into the 3D GAN, and the voxel data is visualized in 3D.
The implementation consists in a client-server configuration with three modules: the server, the drawing application, and the visualization application. The server is configured using Flask and FlaskIO to implement a fast and fluid communication between clients using sockets. We use a portable wi-fi router with a static IP address to communicate between the server and the clients. The drawing application was written in C# using Unity 3D game engine and built for iOS. We used a 2018 iPad Pro as the main device for the demo. The drawing application implements a raycasting system over a rendered texture to generate the 2D pixel information. This is a somewhat hacky way of implementing a skething interface, but it allows us to use the Unity game engine and compile the application to virtually any platform without further work. Once the user finished their sketch, by pushing the predict button, the app transformed the render texture into an array of RGBA values sent as a JSON object through socket communication (SocketsIO). The server received the JSON object and processed the pixel information in our system. Finally, once received and processed the information on the server side, a 64x64x64 array is sent as JSON object to the second client for visualizing the 3D Model. The C# visualization application consists in a 3D navigator that renders a procedural watertight mesh from the array. We use a procedural mesh algorithm to achieve speed and fluidity in the visualization and avoid rendering occluded meshes. The application is built for WebGL and can thus be hosted on any server, although we have only run it locally thus far.
This project shows that machine learning can be used creatively to imagine novel, natural ways to interact with generative systems—a 3D GAN in this case. Our model performs decently well from a qualitative perspective, although there is ample room for improvements. We’re most likely going to keep working on this and see how far we can take it.
We started this project with no particular application in mind: we just thought it’d be fun! That said, it could be used for diverse purposes, such as:
Our project demonstrates that machine learning has the potential to act as a comprehension layer translating natural human input into structured machine output. A lot of work in that area has focused on speech recognition, but some ideas are easier to express with visual means, and we hope there will be more work in that area in the future.
In this project, we took a first stab at what is arguably a complex problem. Through multiple iterations, we identified a few promising directions for future work:
This project is ongoing and slated for publication in 2020.